Portal Usage
Portal Usage Report
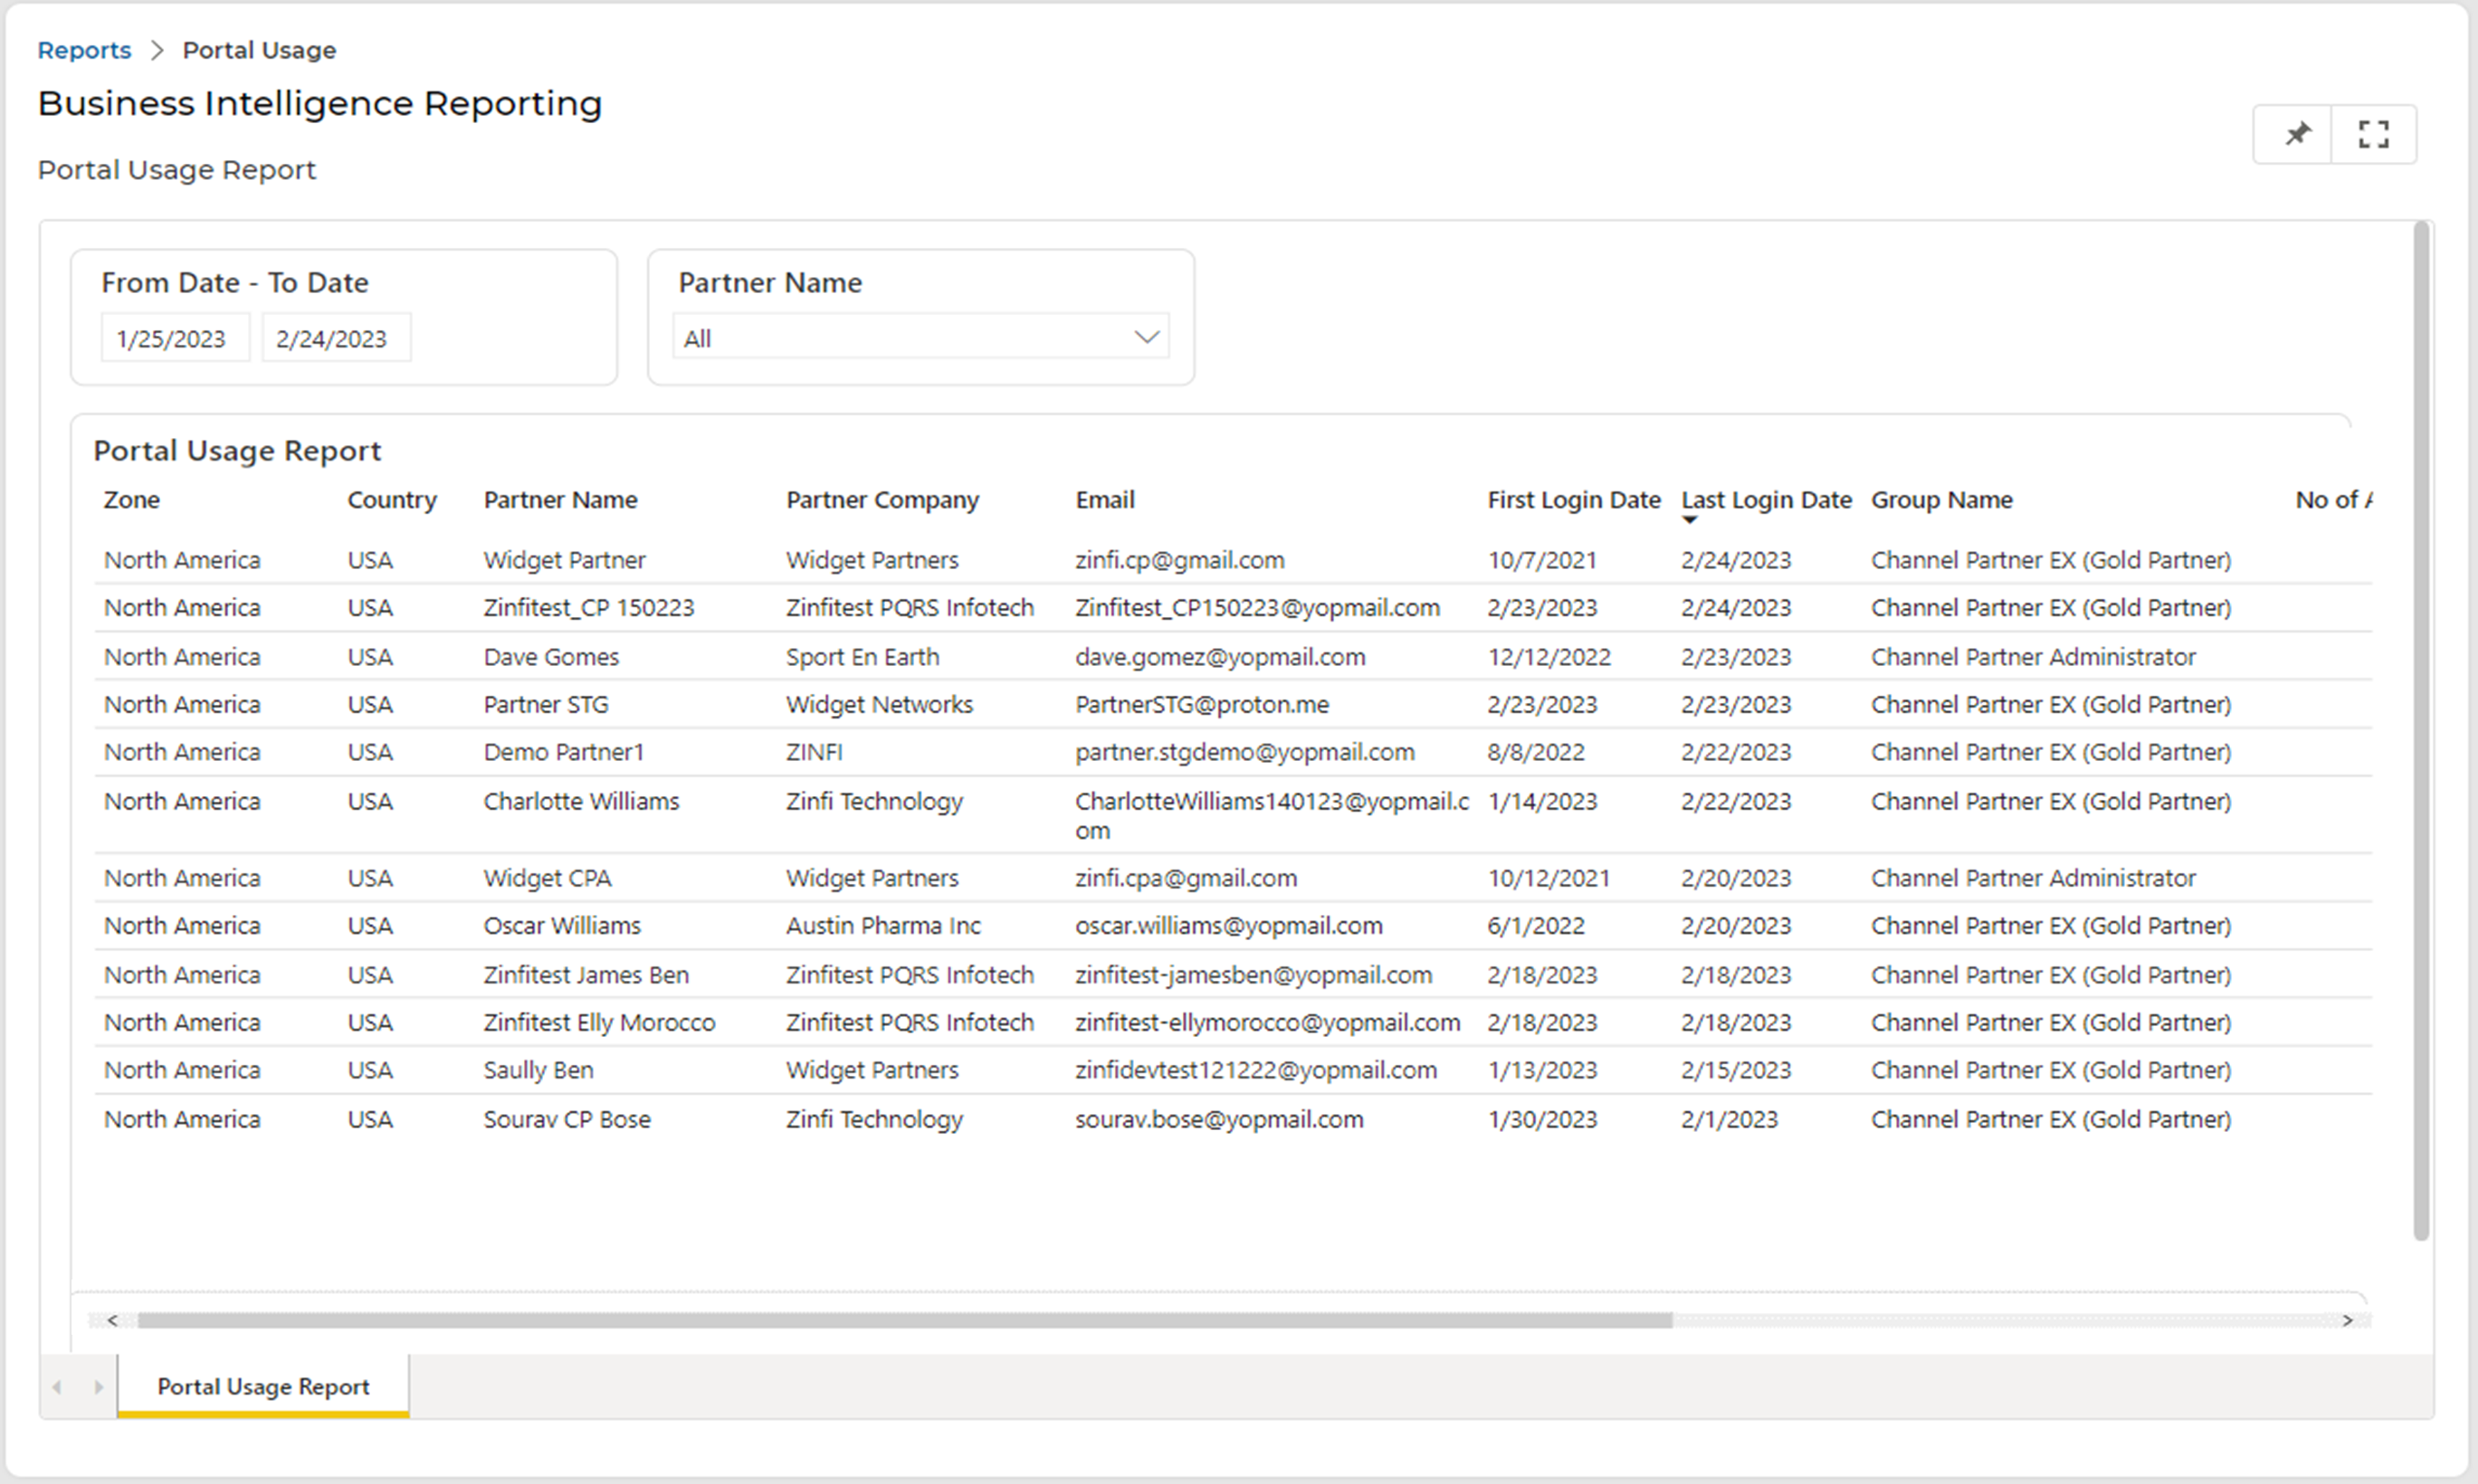
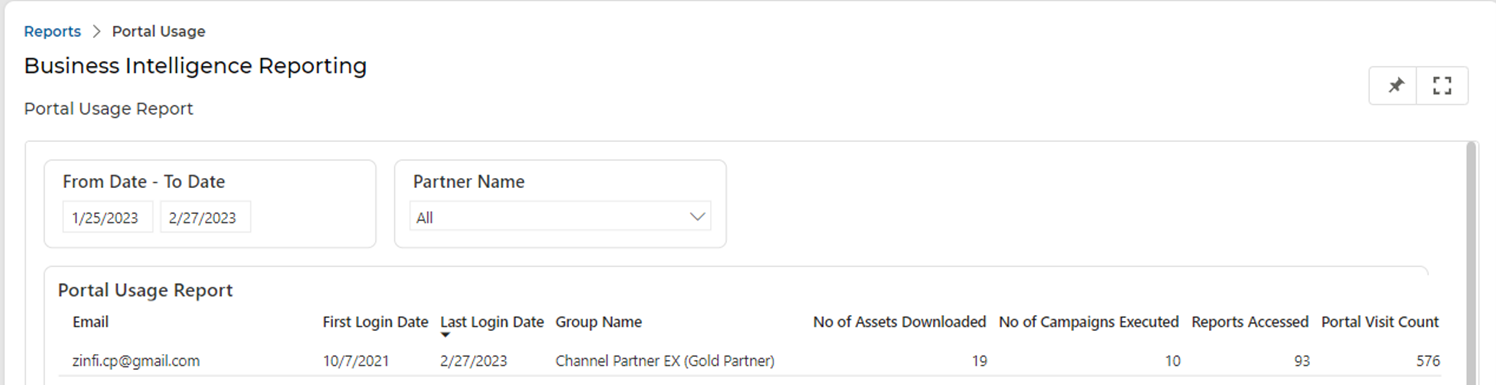
- Clicking Portal Usage will take you to the following Report page, integrated with MS Power BI Report Engine, that displays the logs generated based on the usage of the portal. Report has been upgraded to display some additional columns to summarize ‘No of Assets Downloaded’, ‘No of Campaigns Executed’, ‘Reports Accessed’, and ‘Portal Visit Count’ by the Partner Users.
- No of Assets Downloaded – Shows number of Assets downloaded by Partner Users.
- No of Campaigns Executed – Displays number of Campaigns executed by Partner Users.
- Reports Accessed – Summarizes number of reports accessed by Partner Users.
- Portal Visit Count – Displays Count of times Partner Users have logged in into the Portal.
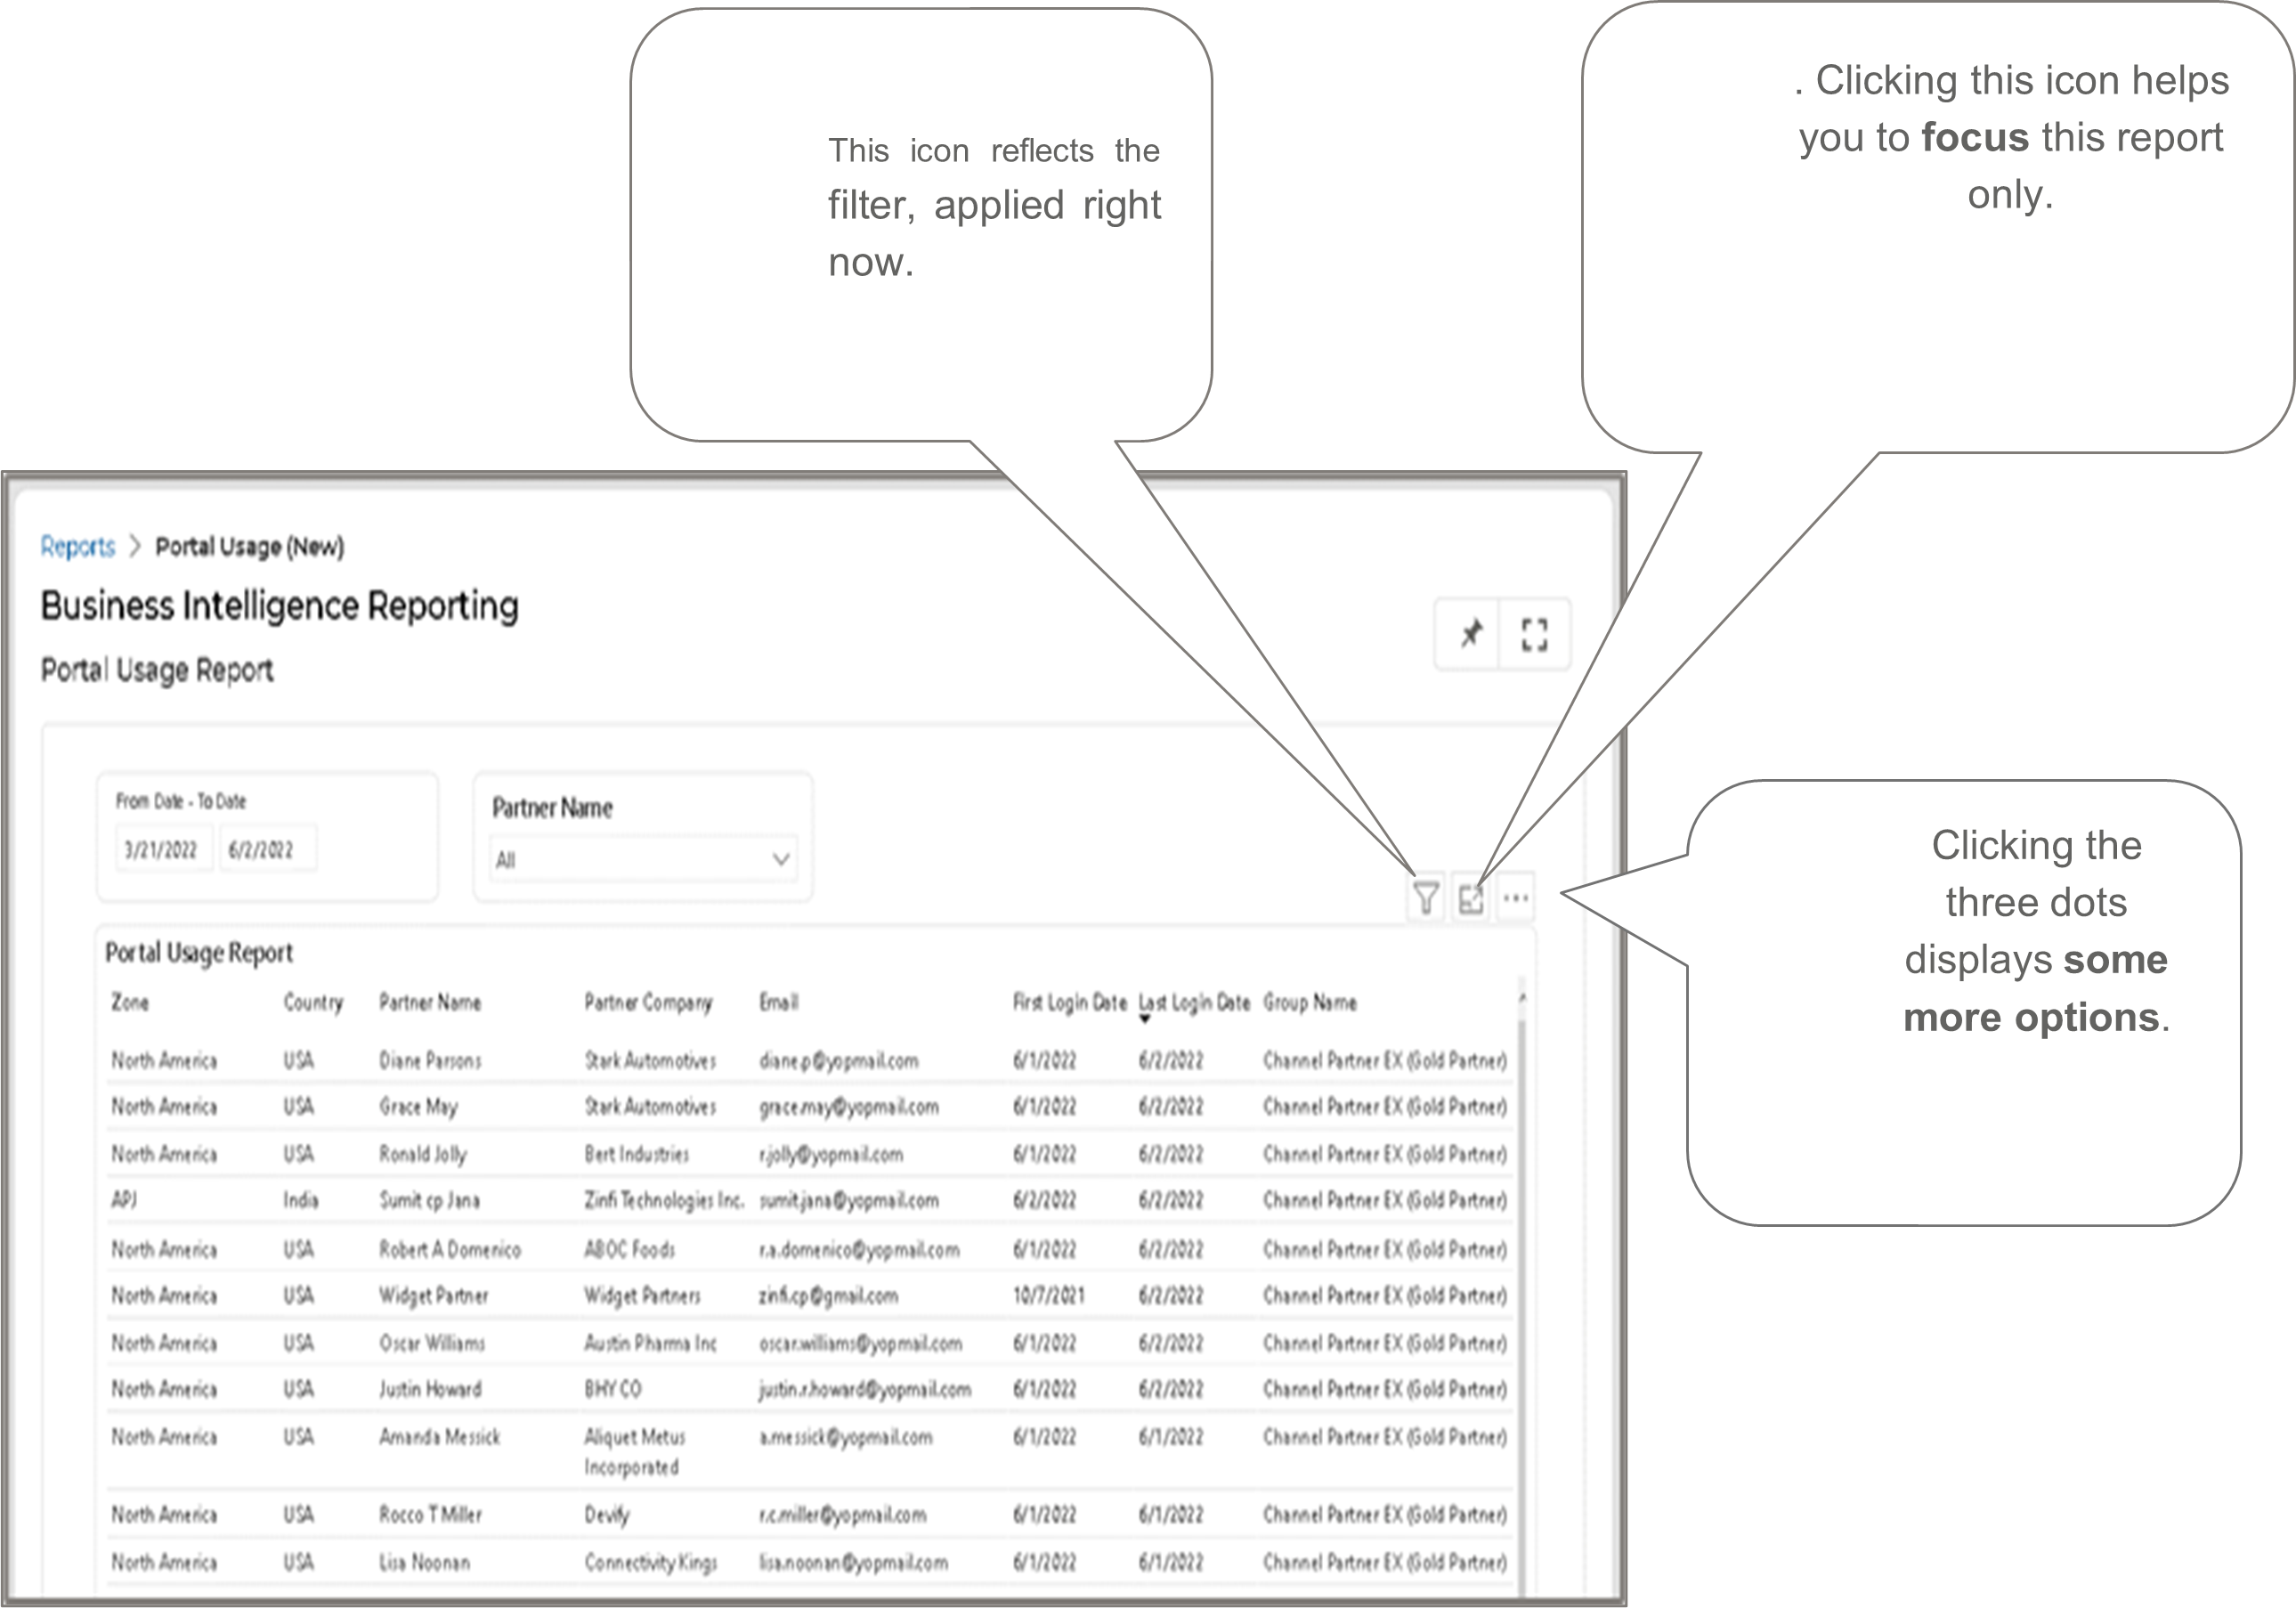
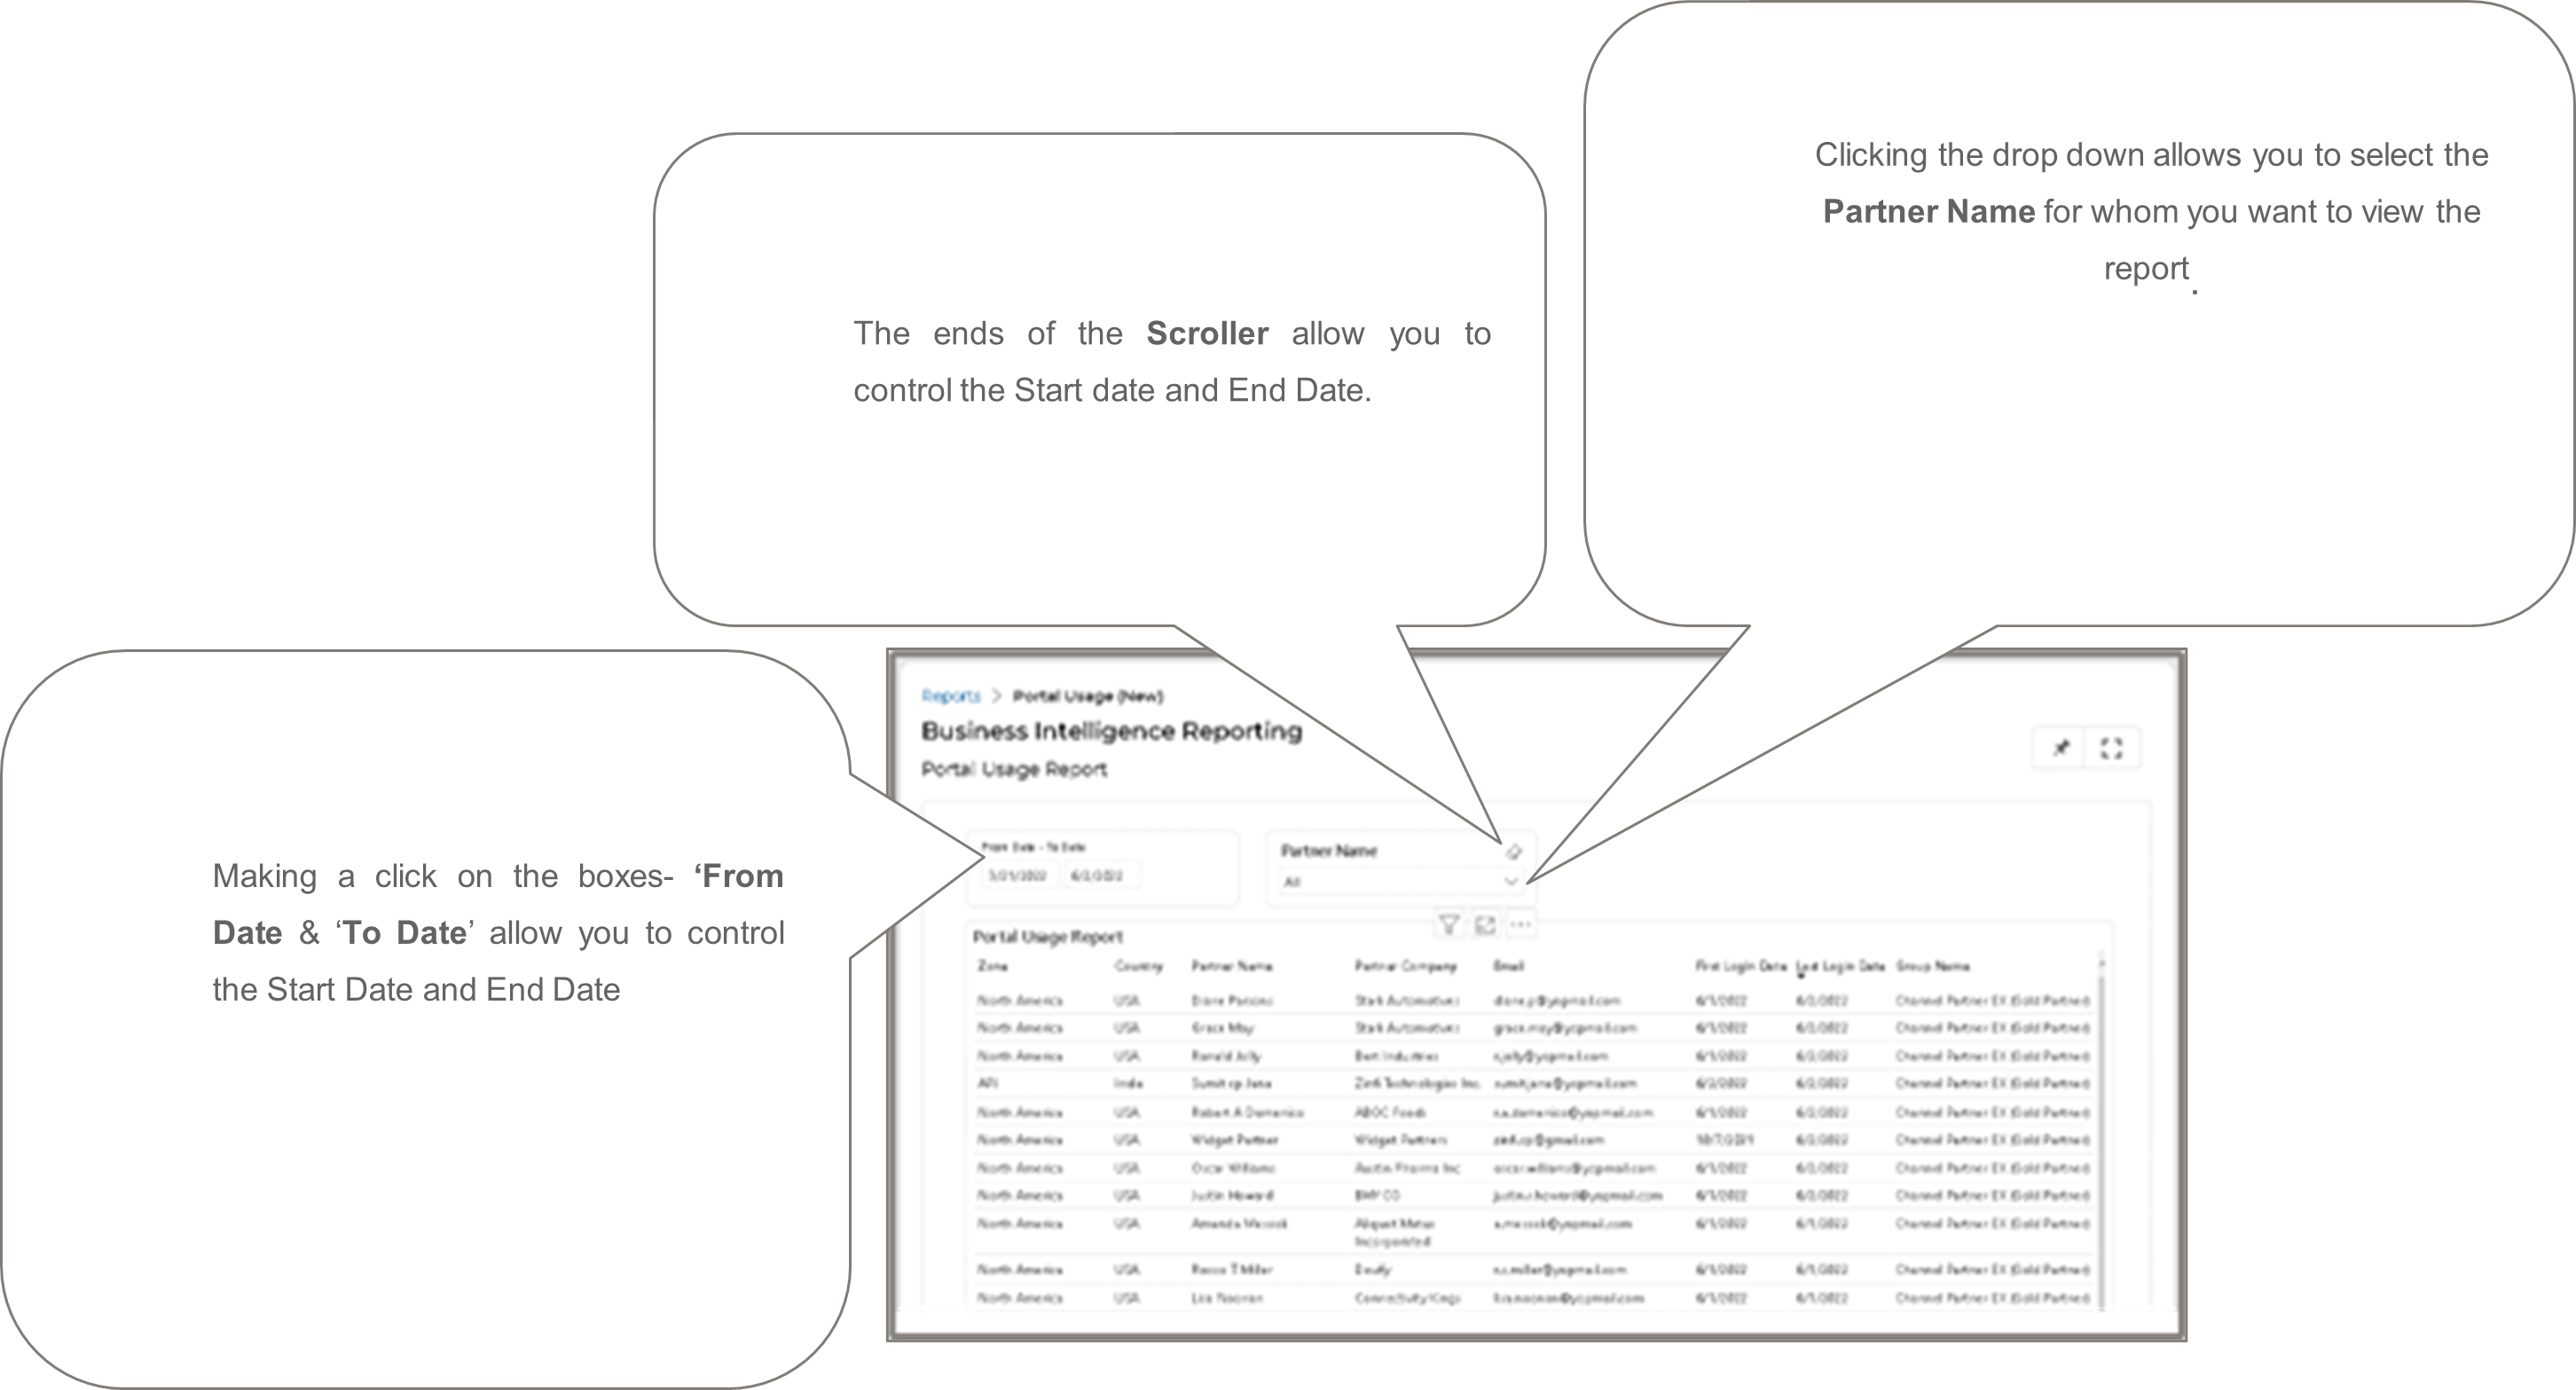
- The reports generated on the usage of the portal can be viewed based on the Partner Name, and Time period as shown in the image below.
- A click on any of the generated report display some additional icons on the top that help you to provide some detailed insights for the respective report.